Our latest study, America’s Workplace Danger Zones, identifies the states where employees face the highest risk of injury on the job. Using the most recent Bureau of Labor Statistics data and national safety reports, we analyzed injury frequency, severity, and industry-specific hazards to pinpoint where risks are most concentrated.
Seasonal surges in labor demand and heightened attention to safety regulations make this an important moment to review injury patterns. In 2023, there were 2.6 million non-fatal workplace injuries and illnesses—an 8.4% decrease from the previous year—yet dangers remain in labor-intensive sectors and states with elevated fatality rates.
Read more to see how these findings affect workers, employers, and policymakers nationwide.
The Scope of Workplace Injuries in 2023
The national injury rate stood at 2.4 cases per 100 full–time workers in 2023, according to the Bureau of Labor Statistics (BLS). But injuries are far from evenly distributed across industries.
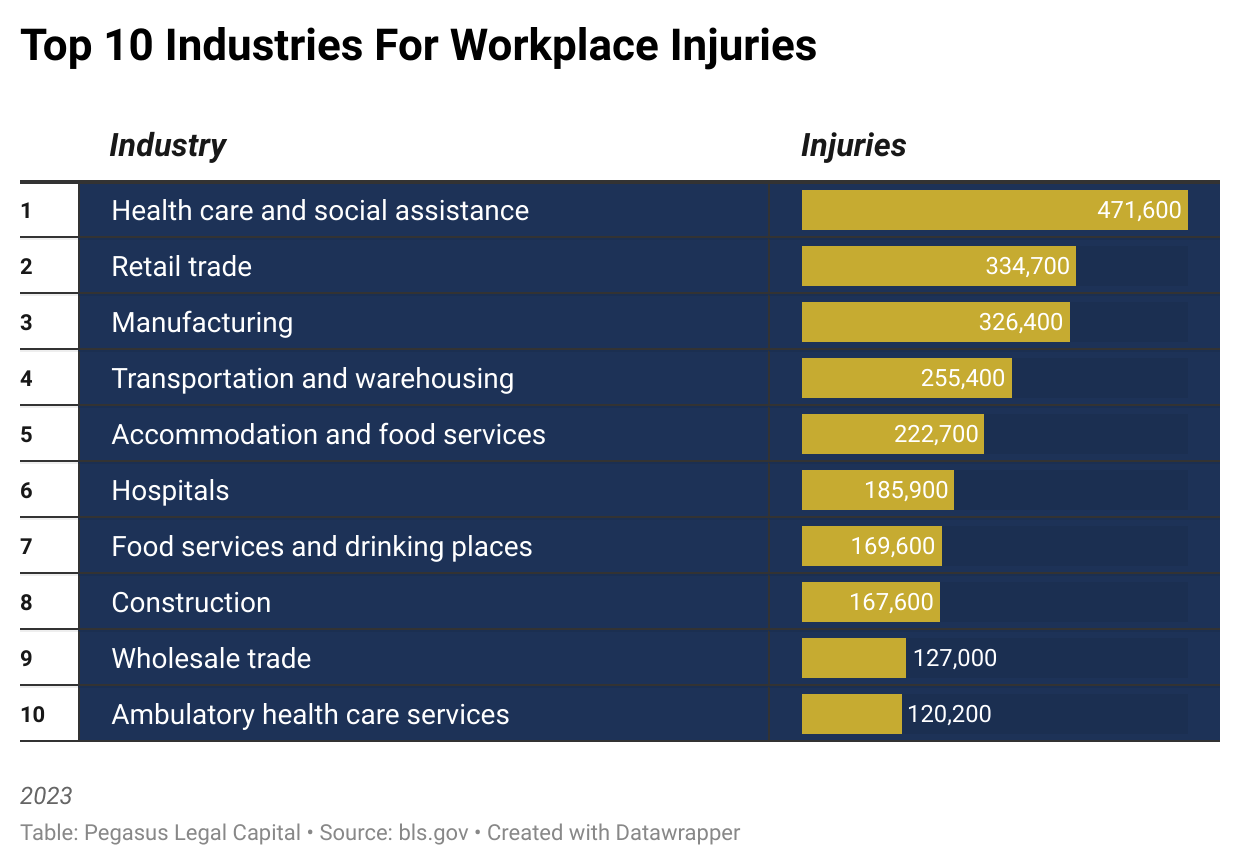
Industries with the highest injury counts:
- Health care and social assistance: 471,600 cases
- Retail trade: 334,700 cases
- Manufacturing: 326,400 cases
- Transportation and warehousing: 255,400 cases
- Accommodation and food services: 222,700 cases
- Construction: 167,600 cases
- Wholesale trade: 127,000 cases
- Administrative/support & waste management: 94,000 cases
- General merchandise stores: 88,900 cases
- Ambulatory health care services: 120,200 cases
These industries share common factors: large workforces, high physical demands, and frequent exposure to environmental or public-facing hazards.
Health Care Workers: The Most Injured Workforce
Health care and social assistance employees experienced 471,600 non–fatal injuries in 2023—more than any other U.S. sector.
Main drivers include:
- Heavy patient handling and repositioning
- Long shifts leading to fatigue
- Exposure to infectious diseases and hazardous substances
- High mental stress and burnout
The sheer scale of injuries in this sector makes it both a labor and public health concern. Safer staffing ratios, ergonomic equipment, and targeted OSHA oversight could reduce these numbers.
Retail: An Overlooked High-Risk Industry
The retail sector ranked second for total workplace injuries with 334,700 cases in 2023.
Contributing factors:
- Repetitive lifting and stocking
- Long hours on hard surfaces
- Customer-related confrontations or assaults
- Slip-and-fall risks in high-traffic environments
General merchandise stores alone accounted for 88,900 cases, making it clear that prevention efforts are needed in an industry too often dismissed in safety discussions.
Workplace Fatalities in 2023
There were 5,283 workplace deaths nationwide in 2023—down from 5,486 in 2022. The national fatality rate was 3.5 deaths per 100,000 workers.
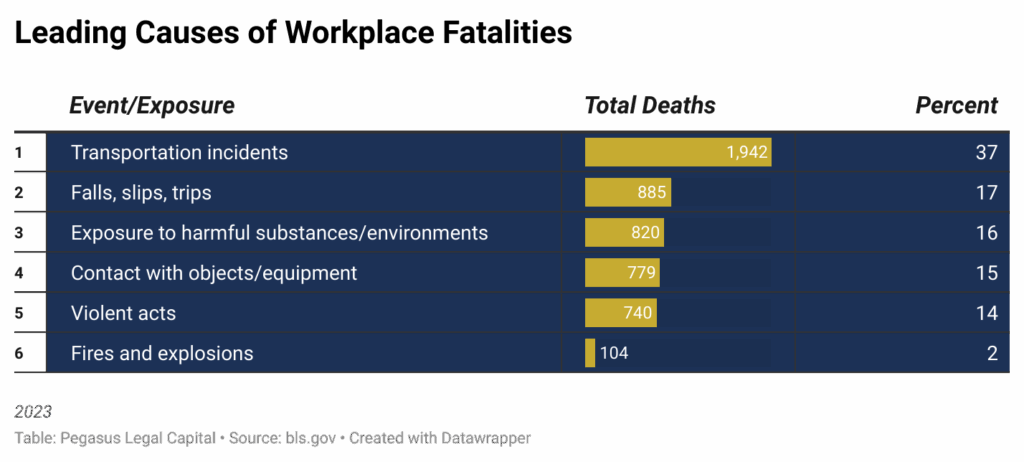
Leading causes of death:
- Transportation incidents: 1,942 deaths (36.9%)
- Falls, slips, trips: 885 deaths (16.8%)
- Exposure to harmful substances/environments: 820 deaths (15.6%)
- Contact with objects/equipment: 779 deaths (14.8%)
- Violence and animal attacks: 740 deaths (14%)
Transportation remains the most lethal hazard, but falls, exposure risks, and struck-by incidents together make up more than half of all workplace deaths.
Tennessee: The Most Dangerous State for Workers
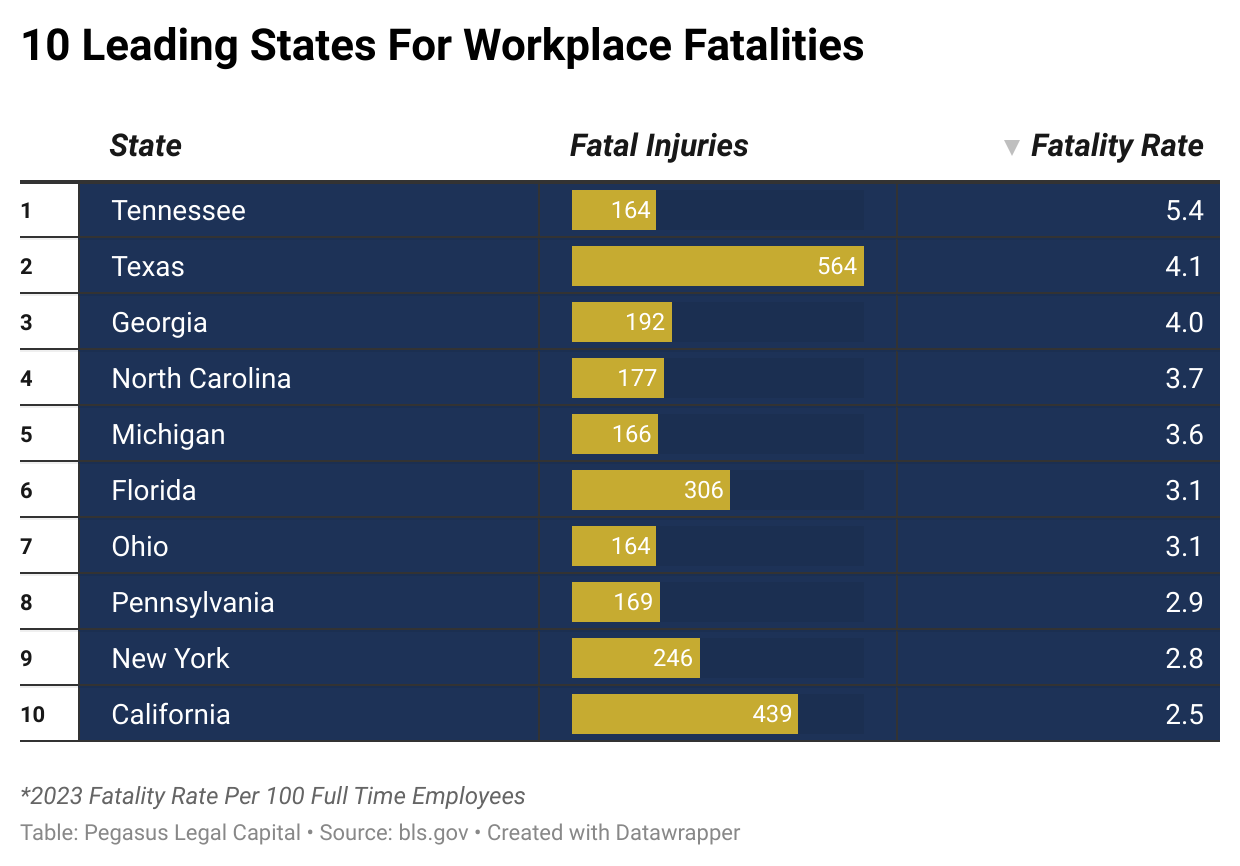
When ranked by fatality rate, Tennessee leads the nation among the top 10 fatality states with 5.4 deaths per 100,000 workers—over 50% higher than the national average.
High-risk industries contributing to Tennessee’s rate:
- Construction and extraction
- Trucking and freight operations
- Manufacturing and heavy equipment
These numbers call for targeted state-level interventions in safety training, enforcement, and hazard mitigation.
State-Level Injury and Fatality Trends
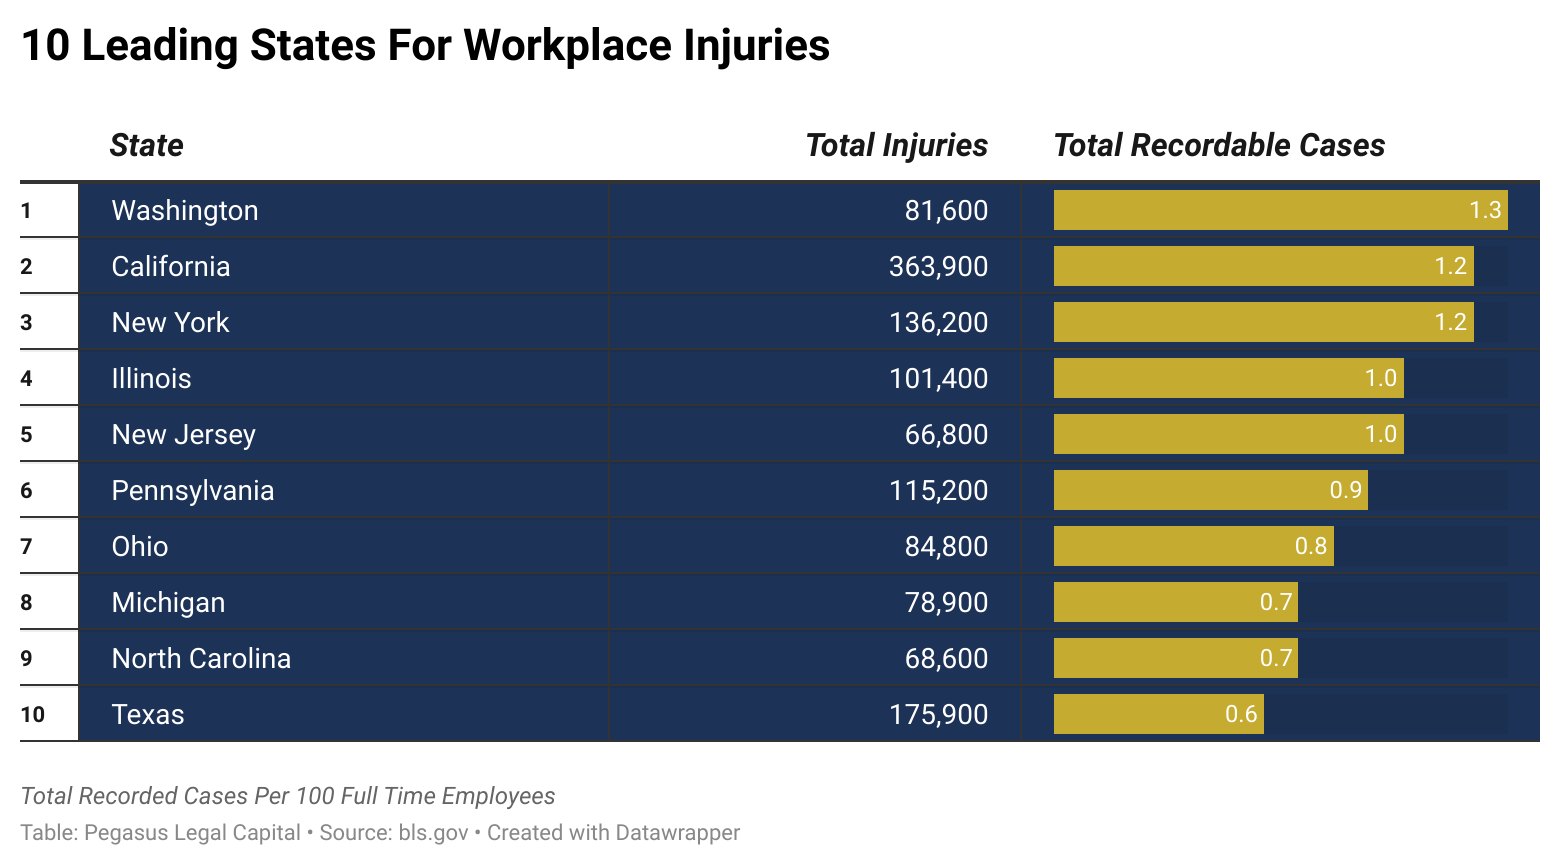
Raw injury totals don’t always match individual risk.
Key examples:
- California: Highest total injuries, but rate of 1.2 per 100 workers
- Texas: 175,900 injuries, but lowest rate among top 10 states (0.6)
- Washington: 81,600 injuries with the highest rate (1.3)
For fatalities, Texas (4.1) and Georgia (4.0) also show above-average rates, while California (2.5) and New York (2.8) have large total deaths but lower per-worker risk.
Fatal Industries: Where the Risk Is Greatest
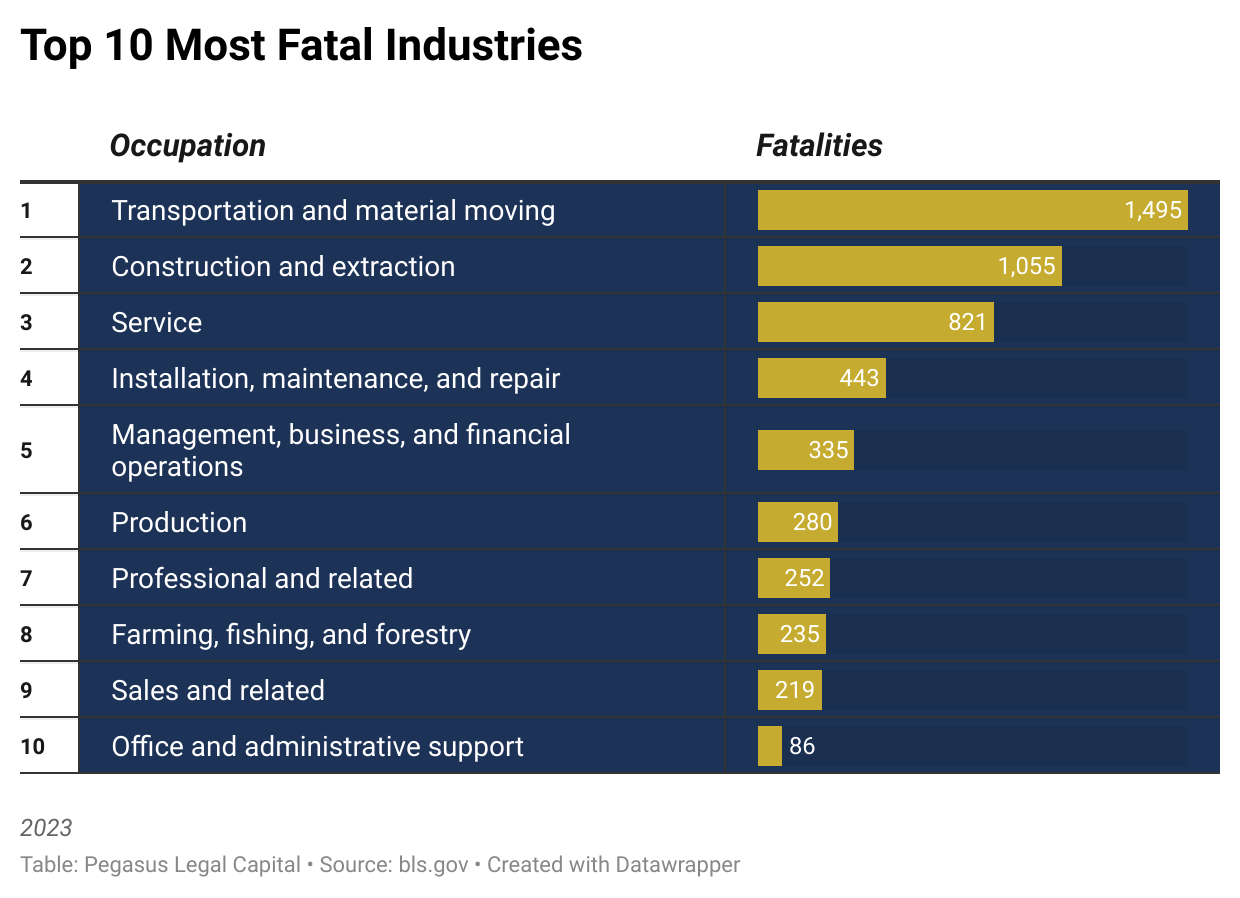
Nearly two-thirds of workplace deaths occur in just two occupational groups:
- Transportation and material moving: 1,495 deaths (28%)
- Construction and extraction: 1,055 deaths (20%)
Other high-fatality sectors:
- Service occupations: 821 deaths (15%)
- Installation, maintenance, repair: 443 deaths (8%)
- Farming, fishing, forestry: 235 deaths (4%)
Office and administrative support roles accounted for only 86 deaths (2%), highlighting the disparity between physical and sedentary work environments.
Economic Impact of Workplace Injuries
The National Safety Council estimates workplace injuries cost the U.S. over $167 billion annually (2021 data). Adjusted for inflation and medical cost increases, today’s figure is likely higher.
Costs include:
- Lost productivity and absenteeism
- Medical treatment and rehabilitation
- Workers’ compensation claims
- Legal settlements and insurance premiums
With over 1 million injuries annually in retail, healthcare, and transportation alone, the economic stakes are as urgent as the human cost.
Federal Policy and the Enforcement Gap
High-risk sectors like transportation, construction, and manufacturing require consistent federal oversight.
Current challenges:
- OSHA’s limited funding and inspection capacity
- Uneven state enforcement standards
- Rising hazard complexity in modern workplaces
Federal investment in hazard-specific training, technology adoption, and stronger penalties for non-compliance could reduce both fatality and injury rates.
Key Findings at a Glance
- 2.6M non-fatal injuries in 2023, down 8.4% from 2022
- 3.5 deaths per 100,000 workers nationally
- Tennessee: 5.4 deaths per 100,000 (highest fatality rate)
- Health care sector: 471,600 injuries (highest of any industry)
- Transportation incidents: 36.9% of all workplace deaths
- Economic cost: $167B+ annually
The Path Forward for Safer Workplaces
Our research shows that while overall injury and fatality counts are declining, risk is still concentrated in specific states, sectors, and job roles.
To address this:
- Prioritize hazard mitigation in high-fatality industries
- Invest in ergonomic and safety equipment in high-injury sectors like healthcare and retail
- Expand OSHA funding for inspections and targeted enforcement
- Leverage state data to tailor prevention efforts
By focusing resources where the dangers are greatest, we can accelerate the decline in workplace injuries and fatalities—and protect more workers nationwide.
When Safety Fails, Support Matters
Even as national workplace safety trends improve, risks remain for workers in high-fatality industries and physically demanding roles. Tennessee and other high-risk states continue to show elevated injury rates, especially in sectors like construction, manufacturing, and healthcare. These persistent gaps highlight the importance of focused prevention and equitable support.
For those affected, work–related injuries and lawsuit funding can provide critical relief while legal claims are pending. This financial support helps injured workers manage bills, medical costs, and daily living expenses during uncertain times—without pressure to accept a low settlement.